OTAs, Defense Tech, & The Path To Revenue
Pulling all DoD Other Transaction Agreements reveals cultural differences between services, data disparities, and signs of hope.
Chris and Raj’s fantastic book Unit X got me thinking about the intersection of culture and tools in defense acquisitions – so I pulled every Other Transaction (OTA) contract in the public record. Have you ever wondered who uses OTAs? Besides DIU?
If you like granular analysis and numbers – this piece is for you.
Major Takeaways:
1. Pentagon shops have spent over $86B via OTAs
2. They did most of this in the last five years
3. DARPA is the pioneer, DIU is underfunded, and Army is by far the best wielder of OTAs
4. DARPA and SCO do a lot of Navy’s heavy R&D lift via OTAs
5. Individual contracting offices’ processes and culture vary widely
6. Most big contracting offices (e.g. PEOs) are missing in action
7. OTA consortia distribute most OTA contract value
8. Consortia don’t necessarily allocate OTAs differently than government does
9. Silicon Valley companies are using OTAs to build a path to revenue
10. Most important trend – the relative % growth of three numbers: Venture-backed companies OTA revenue > DoD spend via OTA > DoD budget
Methodology + Major Gaps
- Except when a source is explicitly cited, I used Federal Procurement Data System
- How many of these contracts is DIU executing for services?
- How many contracts go unreported? I know of numerous unclassified contracts that wouldn’t show up in FPDS, no matter what search terms I used
Intro
To back up, Unit X tells the founding story of the Defense Innovation Unit (DIU). DIU started with no money, no credibility in most of the bureaucracy, and a small cadre of great Americans determined to help modernize Pentagon tech purchasing.
A DIU contract specialist noticed an acquisition rule change: simple, fast contracts called OTAs could be used much more expansively, including for production. She explained to Raj and Chris that anyone in the federal government could use them, not just DIU. Previously OTAs had been limited to research, development, and prototype work.
OTAs had been around since the space race, authorized by President Eisenhower to ease NASA’s ability to work with non-traditional contractors and build great technology to take us to the moon. But OTA usage never took off. Culture within the acquisition bureaucracy preferred paperwork-heavy, risk-light contracts. They take years to execute.
Over the last decade, OTA usage has swelled. Various Pentagon shops have spent over $86 Billion via OTAs. DIU is an essential catalyst, but only a small part of the story. Since its inception, DIU has spent around $1B via OTAs.
Rough structure of this piece:
Department OTA expenditure (Army vs Navy vs Air Force vs Joint)
Joint agencies OTA expenditure (DIU, DARPA, and 13 additional DoD-level contracting shops not affiliated with a service branch)
Service breakouts. For each one, we’ll go down to the contracting office level, which ranges from an O6 to an O9, depending on the command
Army
Navy
Air Force
OTA Consortia: there is a lot to unpack here 😊
Recipients: what companies are these contracts actually going to?
This is Personal
While Raj and Chris were forming DIU, I was an O1 in the Navy, leading an IT modernization team.
We were behind by several Windows operating systems. We were running on Firefox 35 while industry ran on 60, and turned off features for our version. We were physically laying down fiber to replace copper wires run in the cold war. Under the floor tiles of one intelligence agency we found whole nests of snakes and rats.
When I had some extra money in 2018, I looked around for my oldest piece of tech to upgrade. I learned that all our phones ran off a physical switchboard with a copper wire going to a port for every single phone. It was a room-sized switch that looked like a massive WW2 code-breaking device a la The Imitation Game. My telecoms lead had wanted to upgrade to a digital system for years, but my boss shut us down. Upgrading would be too much of a hassle. She insisted we still spend all the money. If we didn’t, we would lose it to another department next year.
She ordered me to buy several hundred thousand $$ of extra color printers. It took almost a year to get the massive printer order, which required higher-up contracting officers to sign off. Previously, I’d been ordering printers and other repair & replacement hardware in small batches on a government credit card – this let me skip the box-checking exercises. And the price for the small orders was the same as for the bulk order. Because we were waiting for the massive order, I stopped ordering 5-10 printers when we needed replacements, and our whole agency actually suffered a printer shortage. We were down to only about a dozen working color printers in the building when officers complained to the admiral at a town hall. I was in the crowd and took responsibility. The large order finally started moving through approvals when I followed up with an email.
In short, low-paperwork contracting tools can get warfighters and spies better tech. Culture and leadership buy-in matter a ton. Both are hard to measure. But I think looking at what offices are using OTAs will tell us something. Let’s dive in.
Service-Level OTA Data & Analysis
My big takeaway here: flexible OTA contracts have been around for a while. The services, not DoD, are the prime movers. In total, the Pentagon has spent $86 Billion via OTAs over the last two decades, with the Army making up over half and the Navy being easily the slowest adopter. We’ll analyze each service in detail later.
5-Year Compound growth calculations show 30%+ growth rates in spending via OTAs over the last 8 years. This number is important because it smooths out the COVID bump, and still shows strong growth.
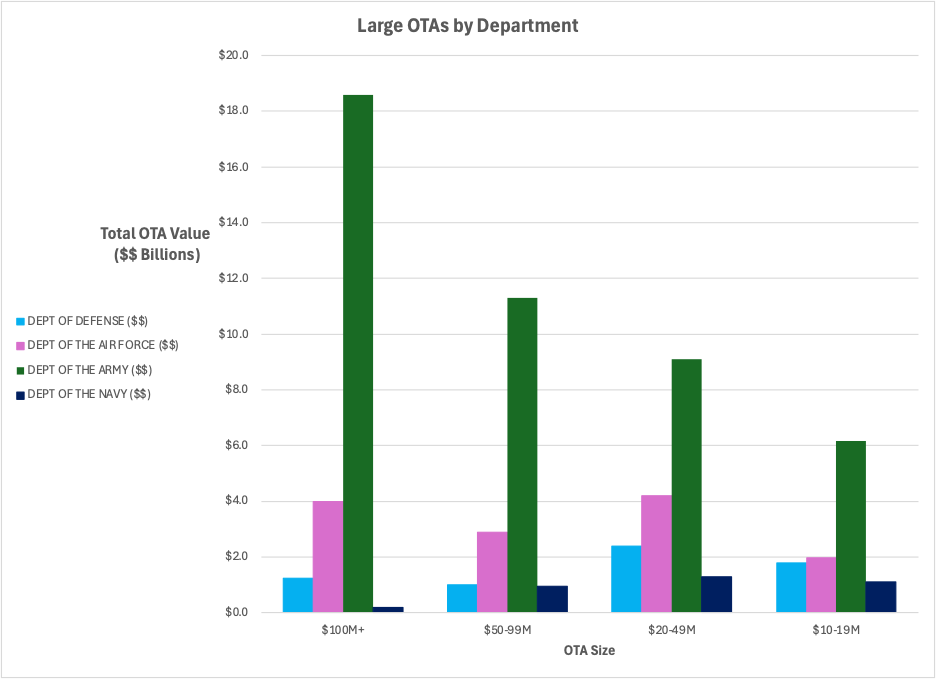
Large OTAs are important to look at. $68B of $86B spent via OTAs comes from $10M+ transactions. However, most of this spend, $45B of its $53B, comes from the Army. Other services don’t spend much more via large OTAs than via small, and the Navy seems to prefer small contracts. Looking at large OTAs likely captures the elusive production OTAs, although most are still for R&D. The chart below shows the total amount of money spent via large OTAs.
Although Army spends lots of $$ via large OTAs, overlaying the quantity of contracts on the total amount of money spent adds context. The below chart still shows the total amount spent, but the bar chart data now emphasizes the quantity of OTAs issued by each service. Army still issues by far the most.
[One note on a change I made manually to the data. About a third of the Space Development Agency data was showing up under DoD, with the rest under Air Force. I moved it all to Air Force for simplicity.]
Joint Agency OTA Data & Analysis
14 joint offices under DoD, ranging from S&T shops to functional COCOMs spent about $9B via OTAs. Last year, the shops with major budgets spent via OTA were:
DARPA: No surprise. They are the pioneers and account for most of the DoD-level OTAs until recently. They’ve spent $3.5B and will likely hit around $500M this year.
Average Contract Size (Overall | 2023): $1.5M | $1.43M
Big Contracts:
The biggest 20 range $25-55M and all went to Lockheed, Raytheon, Boeing, and Northrop.
The 21st biggest went to Moderna in June of 2020 – probably Operation Warp Speed – and there are a few other big ones to biotech shops around that time.
The next few big contracts that jump out, not directed to the biggest primes or emergency pandemic contracts, go to SERCO, who has been building a very expensive (and very autonomous) ship for DARPA.
Since Navy innovation spending lags the other services, I wonder if further analysis would show DoD-level innovation spending making up for Navy lethargy? DARPA, SCO, and DIU, not Navy, have delivered most of the Navy’s expensive uncrewed ships and submarines.
SCO (Strategic Capabilities Office) and OUSD R&E: They are probably most of Washington Headquarters Services. They’ve spent $1.7B since 2018, with $364M in 2023.
Average Contract Size (Overall | 2023): $2.82M | $2.92M[AG1]
Big Contracts: 16 over $20M, 7 of which went to nuclear energy tech and 6 to uncrewed surface vessels. The other 3 went to Boeing.
Missile Defense Agency discovered OTAs about five years ago and has used them to spend about $1B.
Average Contract Size (Overall | 2023): $10M | $12.7M[AG2]
DIU has spent $800M via OTAs since its inception. The Immediate Office of SECDEF line is all DIU but for $20M of CDAO spending which went Palantir’s way. I suspect DIU has spent much more this year, and I suspect DIU has also executed CSOs for service program offices who don’t have the personnel, training, and culture to buy commercial tech, but are happy to MIPR their money over. One Navy program officer told me this is part of the playbook.
Average Contract Size (Overall | 2023): $1.47M | $1.55M
Companies with contracts over $5M: Anduril Industries Inc., Applied Research Associates Inc., Blended Wing Aircraft Inc. (2x), Carahsoft Technology Corporation (2x), Consultants Consortium Inc. The (3x), Hermeus Corporation, Hydroid Inc., Hypersonix Launch Systems Ltd, Jetzero Inc., Joby Aviation Inc., Leidos Inc., Nanograf Corporation, Ridgeline International Inc. (2x), Rocket Lab National Security Llc (2x), Saildrone Inc. (3x), Spaceflight Industries Inc, Swiftships Llc, The Whiskey Project Group Ltd (2x)
A screenshot from DIU’s 2023 Annual Report helps show the need for better reporting. The numbers from FPDS should capture all federal contracts, but show DIU with only about $300M of 2023 OT contracts. DIUs own report shows $502M, and that number should only touch prototyping. DIU’s report also highlights $5.5B of contracts since 2016, impossible to track in the open source federal contracting data. DIU should know more than the public about its own operations, but big DoD should also report how it spends taxpayer dollars more transparently.
SOCOM, TRANSCOM, and CYBERCOM spent $768M, $166M of which came in 2023, via OTAs. It was really nice to see COCOMs that have their own tech needs liberated from service acquisition bureaucracies. Where are the geographic combatant commands though?
Average Contract Size (Overall | 2023): $1.92M | $1.91M
Big Contracts: These look like IT. It’s good that COCOMs have their own money to solve IT problems, but IT is something big DoD should probably take care of.
Army OTA Data & Analysis
The biggest trend: Army OTA spending is healthily growing in some areas, but leveling off in others. Of the 9 offices that spent $100M per year, 4 seem to be increasing their year-on-year embrace of OTAs, whereas the rest are holding or reducing their OTA spend.
Average Contract Size (Overall | 2023): $8.5M | $6.8M
Big Contracts:
$100M : 67 OTAs totaling $18.6B
$50-99M : 160 OTAs totaling $11.3B
$20-49M : 297 OTAs totaling $9.1B
Army OTAs also had a massive COVID bump: $23.8B of OTAs came in 2020 and 2021 alone. This was probably a bump of about $12.8B or 116%. I love seeing this because it proves OTAs can be turned to when we need to quickly solve problems with DoD $$. Hopefully, it gave contracting officers good muscle memory.
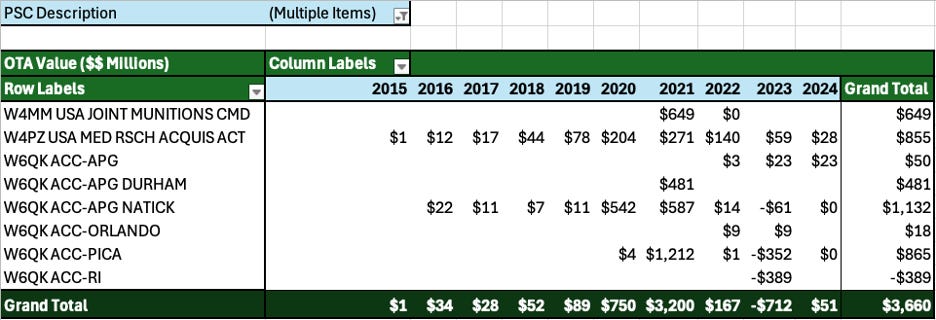
ACC Picatinny has seen a nice growth in OTA usage, which could be ammunition related, either ours or Ukraine’s. However, Picatinny calls itself “the Army’s Center of Excellence for OTAs,” not just a munitions buyer. The billion dollar OTAs during COVID probably weren’t ammo.
The below table adds up all the spending on 8 categories that identify as ammunition. Only $136M and no evident Ukraine bump shows up.
Similarly, the table below filters for all the sub-categories of medical & biological Army OTAs. Only $3.6B of spending shows up and ignores most of Picatinny’s $14B of 2020-2021 spending.
Part of the reason most of the R&D is labeled as broad defense R&D is that most of it is going to OTA consortia like Advanced Technology International, rather than going directly to firms executing work. My takeaway: better data & reporting is needed.
Navy OTA Data & Analysis
18 Navy shops, of which 12 are RDT&E warfare centers, have spent $7B on OTAs. 2019 looks like the first year Navy shops started trying OTAs in earnest, and contracting via OTAs has doubled many years since.
Average Contract Size (Overall | 2023): $2.8M | $2.7M
Big Contracts:
$100M+ : 2 OTAs totaling $231M
$50-99M : 13 OTAs totaling $959M
$20-49M : 44 OTAs totaling $1.3B
Almost all the big contracts go from warfare centers, mainly Surface Warfare Center Crane, to OTA consortia. Of the 28 OTAs over $20M in 2023, 25 went to OTA consortia. 16 of 28 were issued by Crane including 8 of the top 9 worth $0.5B.
My big takeaway: if an office starts using OTAs, training, and becoming comfortable, they can probably become a pretty solid, responsive customer. The NIWCs, Dahlgren, Crane, and Indian Head have all grown into serious OTA contractors – and this probably enhances their ability to rapidly bring industry capabilities onto contract.
Where are the PEOs?
The RDT&E Warfare Centers account for 88% of Department of the Navy OTA spending, with only 6% being spent by the offices responsible for equipping the Navy. NAVAIR and NAVSEA spent about $50M each in 2023 via OTA, with the rest of the major acquisition shops missing in action.
BLUF: The offices with tens-of-billions of budget haven’t figured out OTAs, and are spending a fraction of a percent of their appropriation via OTA. In fairness, most of their budget is locked in to buy very expensive, long-lead time ships and aircraft. But warfare has changed drastically this year, and last year, and the year before that. Spending 99% of a budget via contracting methods designed to buy 5-10 year-old technology means 99% of your technology will be old. And spending <1% via rapid contracting methods means your arsenal will lag the needs of your sailors and the capability of your country’s technology by years. PPBE & requirements have surely locked away most of the money.
Culture, Compliance, & Lawyers: The Navy program managers I’ve talked to recently about contracting culture say that Navy PEO lawyers can’t seem to get comfortable with signing off on OTAs. Understanding that culture takes time to change, like a habit, I find it interesting that the lawyers are the impediment. In theory, they went to the same law schools and have received the same DAU training as their Air Force and Army peers. But they’re interpreting the contracting law more conservatively once they arrive at their PEO. It’s probably worth a controlled study in strategic HR for the Navy where one program office gets their lawyers swapped out with Air Force or Army lawyers, another gets re-trained by DAU and their chain of command, another gets BCG or Deloitte* to come “fix” their culture, and the rest act as a control. Some of these experiments will surely have negative side effects, but if one of them works, it could scale.
This problem isn’t unique to Navy, but Navy clearly has the most sluggish acquisition culture.
[*Deloitte has earned 10 OTAs worth $44M whereas BCG has earned 2 worth $21M. Rival McKinsey has none.]
Air Force OTA Data & Analysis
The good news about Air Force contracting is that 63 different offices are using OTAs. The bad news: 63 offices are using OTAs and reading a 63 x 15 pivot table is tough. I grouped the 63 contracting offices into 8 subjective buckets, but also have full breakouts of each once you scroll further.
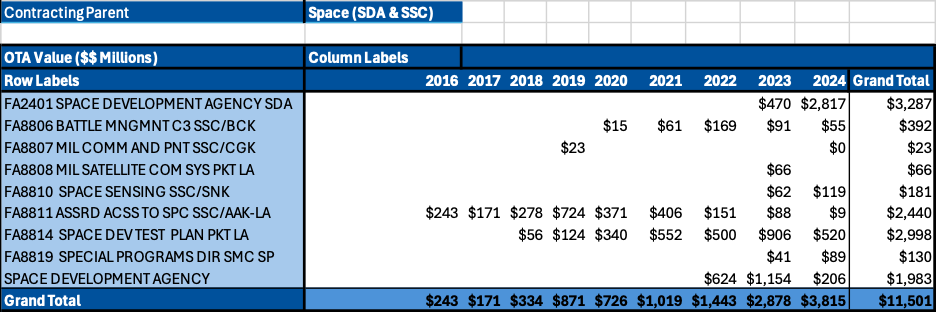
Overall analysis: Kudos first to Space Development Agency for rapid and aggressive OTA employment. If you remove the space-focused OTA spending, Air Force’s contracting officers are no more willing to use OTAs than Navy’s, and have only contracted about $4.5B via OTA.
Was the Space Force a bad idea? Separate bureaucracies for Air and Space Forces likely mean that there is less personnel rotation between the space-focused offices using OTAs and the rest of the Air Force, where they use OTAs even less than the Navy. Hopefully the rest of the Air Force can figure it out.
Average Contract Size (Overall | 2023): $4.8M | $5.9M
Big Contracts:
$100M+ : 27 OTAs totaling $4B
$50-99M : 44 OTAs totaling $2.9B
$20-49M : 133 OTAs totaling $4.2B
OTA Consortia Data & Analysis
OTA Consortia capture $40B or about half of all the OTA money going out the door. Of that money, ATI has touched over $31B. Although the vast majority of this money is passing through the consortia to individual companies, I was a bit surprised at the size role OTA consortia play.
Since an OTA from a DoD contracting office to a consortium does not represent an award to a firm producing goods or services for DoD, we need to look more closely at how money passes through consortia and to firms. Several of the consortia in the table above represent a consortia of consortia.
Eric Lofgren dove into consortia two years ago, highlighting that these OTAs were larger, but slower-growing than stand-alone OTAs. My data suggests the average award to a consortium is $6M, whereas the average OTA overall across DoD is closer to $3M. A GAO graphic Eric referenced also shows nicely how OTA consortia have proliferated over the last decade. They existed before 2014, but now cover most warfare areas.
GAO’s report also shows two other important points. Production OTAs (two year old data) are only a small sliver of overall OTAs.
And, the consortium model adds more layers to an already complex contracting process.
Advanced Technology International (ATI) serves as a useful example because it has solid public-facing data and is easily the largest consortium. ATI collaborates with 23 different industry entities and has made awards in the last year via at least 13 different sub-consortia. These range from ship- and missile-tech consortia to data- and health-focused groups.
Although ATI seems to receive $3-4B per year via OTA, the award data on their website suggests ATI has awarded $6.8B to firms over the twelve months ending August 29th, 2024. ATI could have income sources other than DoD that make up the delta, but the discrepancy suggests DoD contracting offices are not reporting billions of contracts per year. Silicon Valley Defense Group has highlighted the need for better reporting.
Comparing ATI awards to companies to the OTAs awarded by DoD services to companies helps look at how the consortium is spending money. ATI spends far more than Navy or Air Force via OTA, but looking at distributions on a percentage basis helps compare how contracts are moving. The chart below shows that ATI allocates more OTAs in the $50-99M range than the services, and allocates 48% of its money via contracts of this size. Compared to the services, it allocates less money on the very large OTAs or on the OTAs smaller than $50M.
[I tried pulling data to analyze who gets ATI OTAs, but couldn’t identify any patterns or trends notably different than the direct OTAs]
Who Gets OTAs?
In theory they shorten the acquisition cycle. They let DoD buy newer tech. They let America’s most product-centric companies compete on equal footing with its most compliance-focused. Yet only about 1% of Pentagon contracts go to Silicon Valley. Fears that defense tech is in a bubble will not recede unless firms win more contracts or the bubble bursts.
Of the largest 25 recipients of OTAs, almost all are Cold War primes, Fortune 100, or OTA Consortia.
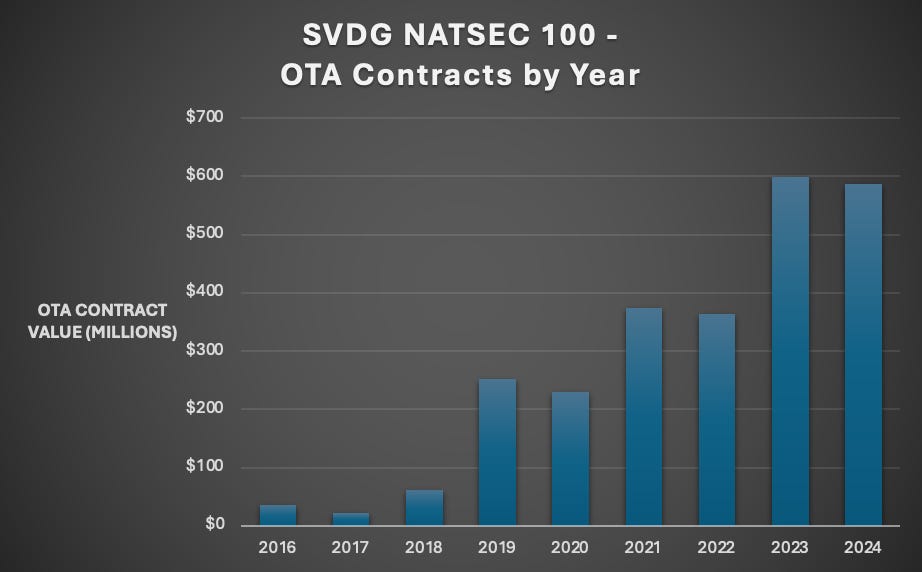
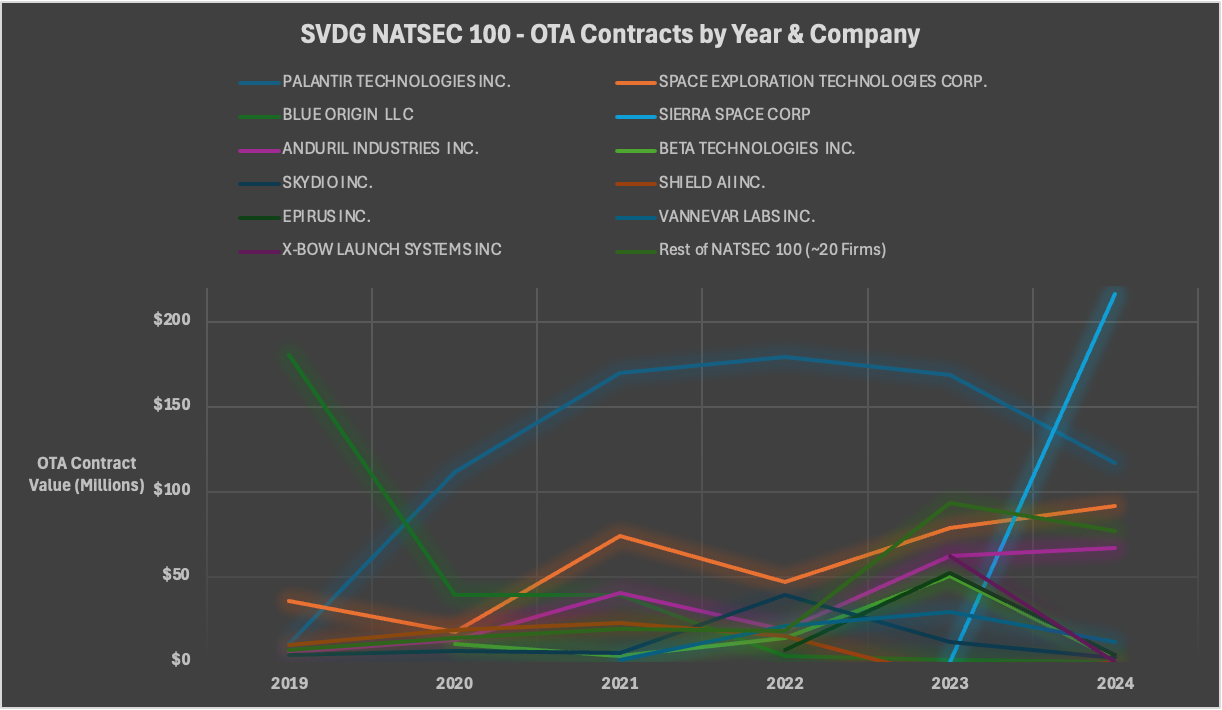
Of Silicon Valley Defense Group’s “NatSec 100” list of non-traditional defense tech companies, 26 have earned $5M+ of OTAs. Together, these firms have earned about $2.6B worth of OTA contracts, including over $500M in both 2023 and 2024.
Together, these 26 firms have used OTAs to grow their bookings. But the list has selection bias and is not necessarily a representative index of venture-backed defense companies. I view this list of companies not as a statistical proxy for the whole industry, rather as showing that companies within the industry can have a path. OTA contracts are part of that path.
Normalizing the data shows that the SVDG companies are growing their OTA contract bookings far faster than DoD is growing its use of OTAs.
SVDG NatSec 100 companies earned $6.3B of DoD awards, of which $2.2B did not go to SpaceX. $2.1B of that came via OTAs, almost all of it in the above list. These numbers gave me some questions, because they suggest basically ALL of Silicon Valley’s Pentagon contracts come from OTAs.
A quick pull of Anduril’s FPDS data shows 407 contracts totaling $673M. And $452M or 67% came from non-OTA contract vehicles. Vannevar Labs, which I think has quite a different business model, has $4M of $74M via non-OTA contracts. Anduril’s numbers alone suggest a (massive) discrepancy between the data SVDG was using and the FPDS data that theoretically should display all unclassified DoD contracts. This will be a great launching off-point for a future post.
OTAs are only part of the path. The path is growing wider, and easier to find.










Hey Austin! Would love to connect, this great data. I did my dissertation on DoD OTs and did a similar data pull. You can see it here: https://digitalcommons.odu.edu/publicservice_etds/49/
Pretty hype - the Economist quoted this article! https://www.economist.com/briefing/2025/02/13/americas-military-supremacy-is-in-jeopardy